Demographics
| Staggering NHRA Sponsor Affinity Information (Source: EventCorp Services, Inc.) | |||||||||||||||||||||||||||||||||||||||||||||||||||||||||||||||||||||||||||||||||||||||||||||
|
- 98% of event attendees feel positively about companies that sponsor the NHRA |
|||||||||||||||||||||||||||||||||||||||||||||||||||||||||||||||||||||||||||||||||||||||||||||
| Castrol Raceway 2015 Update * 62% Male, 38% Female 79% Married or Living with Someone 94% Have Children Under 18 86% Post graduate Education 80% Full time Employment 46% Income over $75,000 57% Consider Themselves "SUPER FANS" |
Attendance Demographics Edmonton 30% Calgary 25% Red Deer 15% Wetaskiwin 10% Camrose 10% Leduc 10% |
||||||||||||||||||||||||||||||||||||||||||||||||||||||||||||||||||||||||||||||||||||||||||||
 |
|||||||||||||||||||||||||||||||||||||||||||||||||||||||||||||||||||||||||||||||||||||||||||||
 |
|||||||||||||||||||||||||||||||||||||||||||||||||||||||||||||||||||||||||||||||||||||||||||||
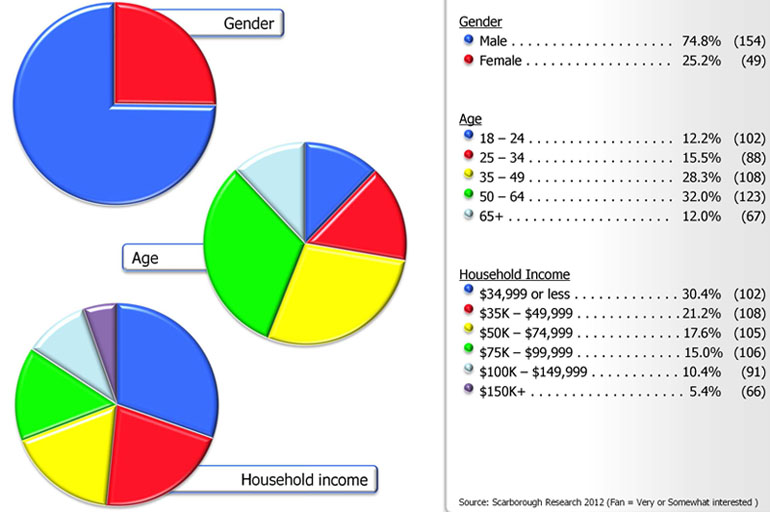
Drag Racing has one of the sports Youngest fan bases compared to all other Motorsports (AGE)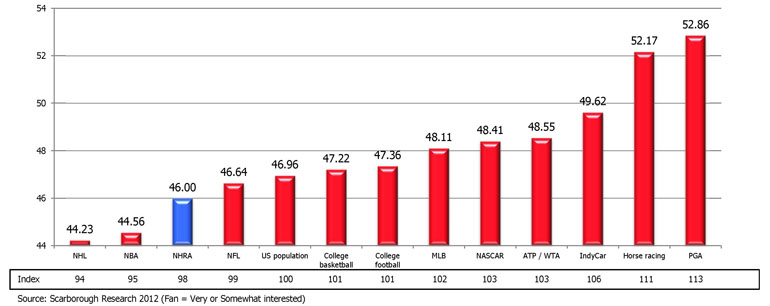 |
|||||||||||||||||||||||||||||||||||||||||||||||||||||||||||||||||||||||||||||||||||||||||||||
Drag Racing provides one of the best sports marketing platforms to reach key male demos (Male 18-49)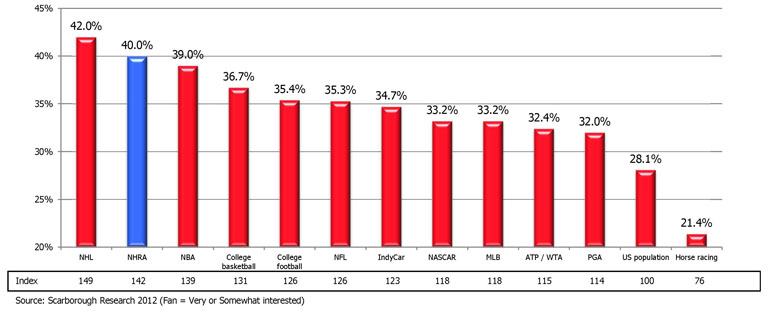 |
|||||||||||||||||||||||||||||||||||||||||||||||||||||||||||||||||||||||||||||||||||||||||||||
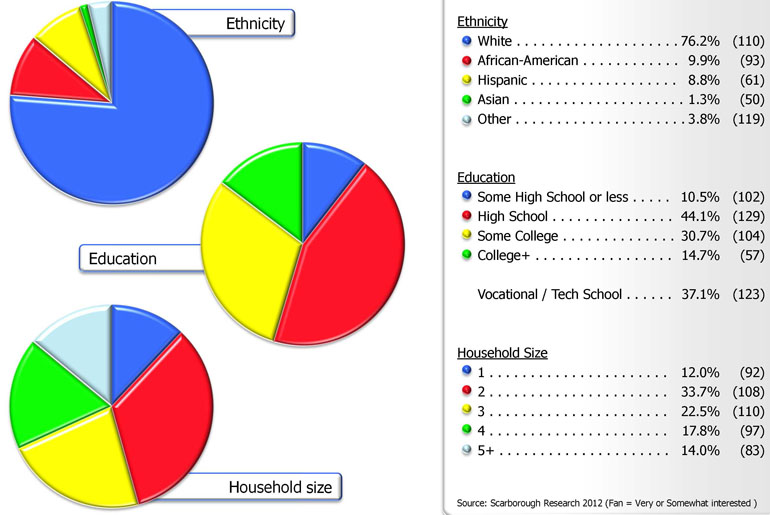
Interests out side of Drag Racing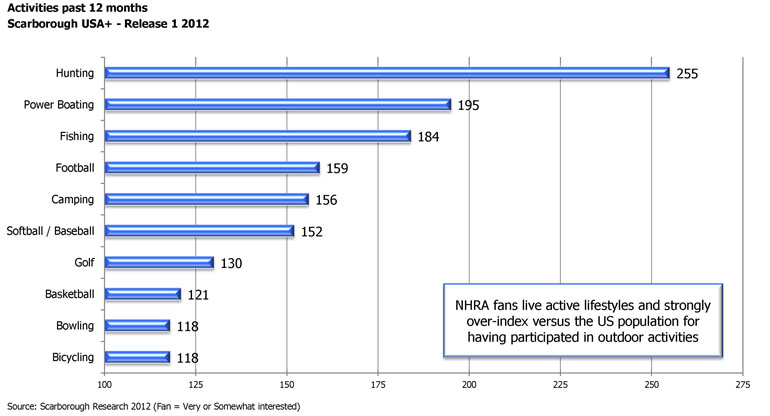 |
|||||||||||||||||||||||||||||||||||||||||||||||||||||||||||||||||||||||||||||||||||||||||||||
| Joyce Julius reaffirms, “Automotive Sponsorship WORKS!” While Joyce Julius and Associates measures the value for the sponsor as compared with equal time on TV commercials, she points to an example of her earlier days working at Domino's. In 1982, when people nationwide were asked to name the top three pizza distributors, Domino's was only named by 7% of those who responded. This type of survey, where people are asked to name the top three of something with no help from the interviewer is called unaided awareness. Their unaided awareness was 7%. Domino's was known on college campuses but never had a nationwide advertising campaign. In 1982, Domino's took their entire national advertising budget, which was still small, and bought an Indy Car instead. They used the money to put the Domino's logo on the car; they sponsored races and established a mobile pizza store that appeared at the races. Three years later, Domino's unaided awareness was 87%. This increase occurred without ever buying a single ad. Now that's exposure! |
|||||||||||||||||||||||||||||||||||||||||||||||||||||||||||||||||||||||||||||||||||||||||||||
|
|||||||||||||||||||||||||||||||||||||||||||||||||||||||||||||||||||||||||||||||||||||||||||||
|
|||||||||||||||||||||||||||||||||||||||||||||||||||||||||||||||||||||||||||||||||||||||||||||